Category: Blog

  • nstu-database-technology

    Лабораторные работы по дисциплине “Технологии баз данных” на факультете ПМИ, НГТУ


    QUERIES

    Запросы к сделанным лабораторным работам и курсовой. Теоретические лабораторные: 1, 2, 3; практические: 4, 5, 8, 9, COURSE.
     

    4. Встроенный SQL

    Запросы из варианта

    1. Выдать число деталей, поставлявшихся для изделий, у которых есть поставки с весом от 5000 до 6000.
    2. Поменять местами вес деталей из Рима и из Парижа, т. е. деталям из Рима установить вес детали из Парижа, а деталям из Парижа установить вес детали из Рима. Если деталей несколько, брать наименьший вес.
    3. Найти детали, имеющие поставки, объем которых не превышает половину максимального объема поставки этой детали поставщиком из Парижа.
    4. Выбрать поставщиков, не поставивших ни одной из деталей, поставляемых для изделий из Парижа.
    5. Выдать полную информацию о деталях, которые поставлялись ТОЛЬКО поставщиками, проживающими в Афинах.

    Условия задачи

    1. Разработать и отладить ESQL/С-программу, реализующую задачу 1 из соответствующего варианта заданий, результатом которой
      является единственная строка.
    2. Разработать и отладить ESQL/С-программу, реализующую задачу 2 из соответствующего варианта заданий и связанную с модификацией
      базы данных.
    3. Изучить синтаксис и правила использования операторов Declare, Open, Fetch, Close, а также особенности работы с курсором.
    4. Разработать и отладить набор ESQL/С-программ, решающих задачи 3–5 из соответствующего варианта заданий с использованием
      аппарата курсоров (последовательного и скроллирующего). Результатом работы программ является набор строк, которые подлежат выводу на
      экран с соответствующими пояснительными заголовками.
       

    5. Динамический SQL

    Запросы из варианта

    1. Получить число поставок для каждого поставщика и найти их среднее.
    2. Для каждого изделия из указанного города найти суммарный объем поставок по каждой детали, для него поставлявшейся. Вывести номер изделия, название изделия, номер детали, название детали, цвет детали, суммарный объем поставок детали для изделия.
    3. Ввести номер детали P*. Найти города, в которые поставлялась деталь P*, и определить, какой процент составляют поставки в каждый город от общего числа поставок детали P*. Вывести город, число поставок деталей в этот город, общее число поставок детали P*, процент.

    Условия задачи

    1. Изучить синтаксис и правила использования операторов Prepare, Execute, а также особенности работы с курсором при выполнении динамического оператора SQL.
    2. Разработать и отладить набор ESQL/С-программ, решающих задачи из соответствующего варианта заданий. Результатом работы программ является одна или несколько строк, которые подлежат выводу на экран с соответствующими пояснительными заголовками.
       

    8. Доступ к базам данных с использованием ADO.NET

    Запросы из варианта

    1. Получить информацию о рекомендованной цене на указанное изделие на заданную дату.
    2. Для изделий, в состав которых входит заданная деталь, сдвинуть на месяц назад дату начала действия последней рекомендованной цены.

    Условия задачи

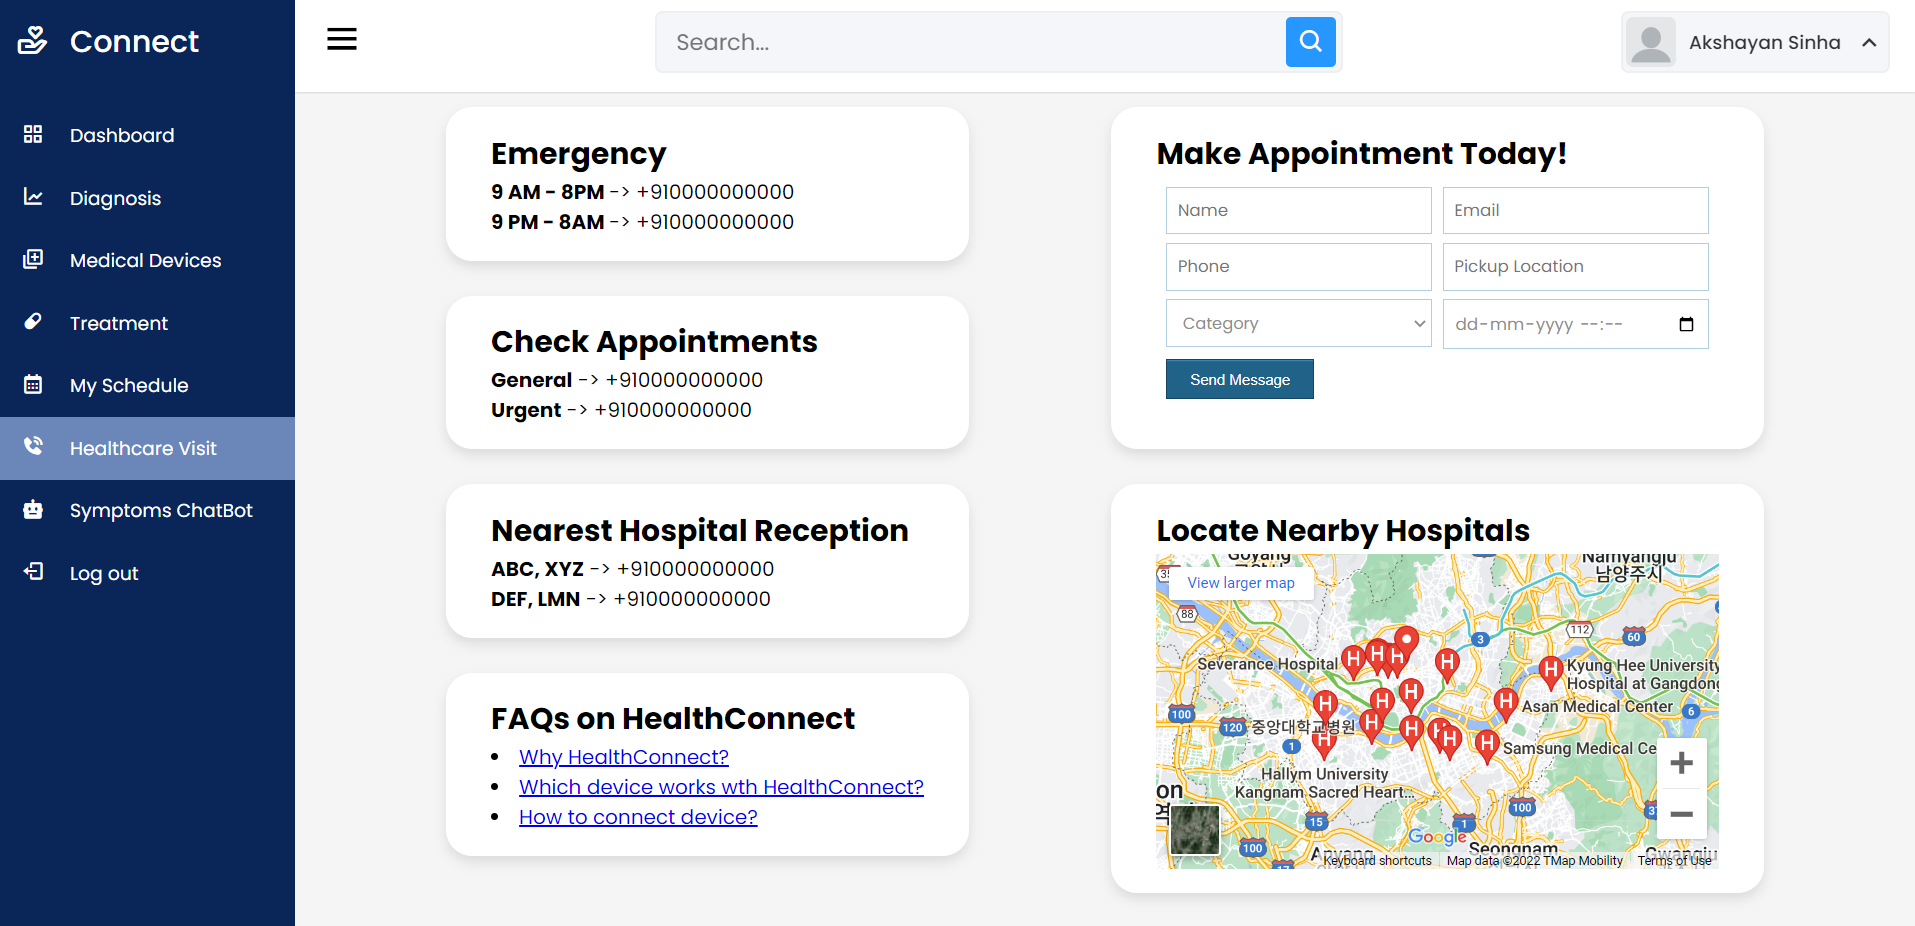
    Разрабатываемое web-приложение должно удовлетворять следующим требованиям:

    • Содержать форму для ввода параметров запросов и отображения результатов выполнения запросов в соответствии с заданием, а также обработчик (на Visial C#) для доступа к базе данных и выполнения запросов;
    • Ввод параметров задания на форме может быть осуществлен либо путем ввода значений в текстовом виде, либо посредством выбора значений из предлагаемого списка (в случае, когда список может быть сформирован из БД).
       

    9. Технология Activex Data Objects (ADO)

    Запросы из варианта

    1. Для каждого изделия на конец каждого года получить:
      • размер максимальной поставки;
      • сумму, на которую выполнены поставки для изделия;
      • процент этой суммы от общей суммы по всем изделиям за год.
      • Упорядочить по году и проценту. Выделить строки, где процент не меньше 50.
    2. Для указанных изделия и года по каждой поставке вывести:
      • сумму поставки;
      • разницу между ценой детали в поставке и средней ценой детали за год.
    3. Изменить цену детали в поставке.

    Условия задачи

    Разрабатываемое приложение должно удовлетворять следующимтребованиям:

    • Приложение должно включать в себя три формы:
      – модуль данных, содержащий все необходимые компоненты для работы с базой данных;
      – форму для просмотра выборок данных;
      – форму для выполнения запроса модификации данных.
    • Соединение с базой данных должно выполняться через компонент ADOConnection. Для выборки данных использовать ADOQuery.
    • Модификация данных должна выполняться либо серверной функцией, вызываемой из приложения через ADOStoredProc, либо запросом через ADOQuery.
    • Просмотр выборок должен осуществляться через компоненты DBGrid. Просмотр должен быть согласованным (выборка по второму запросу должна выполняться для текущей строки выборки по первому запросу). Строки выборок должны быть отсортированы по указанным в задании столбцам. Названия столбцов должны быть на русском языке. Строки выборок, удовлетворяющие указанным в задании условиям, должны быть выделены (цветом фона и/или цветом/стилем шрифта).
    • Визуализация формы для выполнения запроса на модификацию может вызываться либо нажатием кнопки, либо через контекстное меню.
    • Ввод параметров для модификации данных может быть осуществлен либо путем ввода значений в текстовом виде, либо посредством выбора значений из предлагаемого списка.
    • После модификации данных должно появляться сообщение о том, насколько успешно прошла модификация.
    • В случае возникновения ошибки должно выдаваться соответствующие сообщение.
       

    COURSE. Технологии тиражирования данных

    Условия задачи

    Изучить технологии тиражирования данных.

    В схеме базы данных, с которой ведется работа, создаются несколько таблиц одинаковой структуры и единого содержимого, которые имитируют таблицы, находящиеся в различных базах данных.
    Таблицы могут быть любой структуры, но при этом должны содержать два поля:

    • Поле даты/времени для хранения времени вставки/обновления/удаления строки.
    • Символьное поле, идентифицирующее выполненную операцию (вставка/обновление/удаление) и источник изменений.

    Разработать программное обеспечение, состоящее из трех отдельных программ:

    1. Программа инициализации данных (ИД).
      Записывает данные во все таблицы, участвующие в реализуемой схеме модели репликации:

      • В поле даты/времени заносится текущее время инициализации;
      • В поле идентификации операции заносится значение «Начальная вставка».
        Содержимое таблицы, идентичное во всех условных базах данных, запоминается в журнале содержимого таблиц.
    2. Программа имитации работы системы (ИРС).
      С определенной дискретностью (интервал в несколько секунд) моделирует процесс работы информационной системы, выполняя следующие действия:

      • Случайным образом выбирает одну из условных баз данных.
      • Случайным образом выбирает одну из операций (вставка/обновление/удаление).
      • Если выполняется операция вставки, то в выбранную базу данных вставляется строка, в которой:
        – в поле даты/времени заносится текущее время вставки;
        – в поле идентификации операции заносится значение «Вставка».
        В журнале изменений запоминается:
        – время вставки;
        – база данных, в которую выполняется вставка;
        – вставленная строка.
      • Если выполняется операция обновления, то в выбранной базе данных обновляется строка с минимальным id, в которой:
        – в поле даты/времени заносится текущее время обновления;
        – в поле идентификации операции заносится значение «Обновление».
        В журнале изменений запоминается:
        – время обновления;
        – база данных, в которую выполняется обновление.
      • Если выполняется операция удаления, то в выбранной базе данных удаляется строка с максимальным id.
        Перед удалением в журнале изменений запоминается:
        – время удаления;
        – база данных, из которую выполняется удаление;
        – удаляемая строка.
    3. Программа репликатор данных (РД).
      Работает в соответствии с моделью репликации, определенной условиями (схема репликации, условие запуска репликатора, способ разрешения коллизий).
      После выполнения цикла репликации (переноса данных и обеспечения согласованного состояния таблиц) программа РД фиксирует в журнале содержимого таблиц:

      • Текущее время;
      • Содержимое всех таблиц условных баз данных

    Исходные данные

    Схема репликации Запуск репликатора Разрешение коллизии
    Однонаправленное тиражирование
    «Центр-филиалы»

    Изменение (вставка, модификация, удаление),
    выполненное в одной из периферийных баз данных (ПБД), тиражируется в центральную базу данных (ЦБД)

    После выполнения указанного числа транзакций, задаваемого при запуске программы РД В пользу более позднего обновления


    Visit original content creator repository

  • PathFinder

    Web Path Finder

    Web Path Finder is a Python program that provides information about a website. It retrieves various details such as page title, last updated date, DNS information, subdomains, firewall names, technologies used, certificate information, and more.

    Features and Benefits

    • Retrieve important information about a website
    • Gain insights into the technologies used by a website
    • Identify subdomains and DNS information
    • Check firewall names and certificate details
    • Perform bypass operations for captcha and JavaScript content

    Getting Started

    1. Clone the repository:

      git clone https://github.com/HalilDeniz/PathFinder.git
    2. Install the required packages:

      pip install -r requirements.txt

    This will install all the required modules and their respective versions.

    Usage

    Run the program using the following command:

    ┌──(root💀denizhalil)-[~/MyProjects/]
    └─# python3 pathFinder.py --help                                             
    usage: pathFinder.py [-h] url
    
    Web Information Program
    
    positional arguments:
      url         Enter the site URL
    
    options:
      -h, --help  show this help message and exit

    Replace <url> with the URL of the website you want to explore.

    Example Output

    Here is an example output of running the program:

    ┌──(root💀denizhalil)-[~/MyProjects/]
    └─# python3 pathFinder.py https://www.facebook.com/
        Site Information:
        Title:  Facebook - Login or Register
        Last Updated Date:  None
        First Creation Date:  1997-03-29 05:00:00
        Dns Information:  []
        Sub Branches:  ['157']
        Firewall Names:  []
        Technologies Used:  javascript, php, css, html, react
        Certificate Information:
        Certificate Issuer: US
        Certificate Start Date: 2023-02-07 00:00:00
        Certificate Expiration Date: 2023-05-08 23:59:59
        Certificate Validity Period (Days): 90
        Bypassed JavaScript content:  

    Contributing

    Contributions are welcome! To contribute to PathFinder, follow these steps:

    1. Fork the repository.
    2. Create a new branch for your feature or bug fix.
    3. Make your changes and commit them.
    4. Push your changes to your forked repository.
    5. Open a pull request in the main repository.

    Thanks

    • Thank you my friend Varol

    License

    This project is licensed under the MIT License – see the LICENSE file for details.

    Contact

    For any inquiries or further information, you can reach me through the following channels:

    Visit original content creator repository

  • aks-aad-integration

    aks-aad-integration

    Steps involved in creating an AKS cluster integrated with Azure Active DIrectory(AAD)

    Prequisites

    1. Azure Subcription
    2. Access to Azure AD and permissions
    3. AZ CLI installed
    4. Kubectl installed

    Create an Azure Active Directory App Registration – For AKS server

    Integrating AKS with AAD involves creating 2 AAD app registrations. One representing the server and another one for the client.

    az login

    AAD_AKS_SERVER_APP="AKSAADServerApp"

    #Create server app registration

    az ad app create --display-name=$AAD_AKS_SERVER_APP --reply-urls "https://$AAD_AKS_SERVER_APP"

    #Set the groupMembershipClaims value to All in manifest

    az ad app update --id $SERVER_APP_ID --set groupMembershipClaims=All

    Make a note of the app id returned above
    `
    SERVER_APP_ID=
    #Create a secret
    az ad app credential reset –id $SERVER_APP_ID

    #Make a note of the password in the output returned above
    SERVER_APP_PASSWORD=

    `#!/bin/bash

    ENV_SHORT_NAME=’dev’
    AAD_SCOPE=’Scope’
    AAD_ROLE=’Role’
    SERVER_APP_NAME=aksaad${ENV_SHORT_NAME}serverapp
    USER_READ_ALL_DELEGATED=’a154be20-db9c-4678-8ab7-66f6cc099a59′
    DIRECTORY_READ_ALL_DELEGATED=’06da0dbc-49e2-44d2-8312-53f166ab848a’
    DIRECTORY_READ_ALL_APPLICATION=’7ab1d382-f21e-4acd-a863-ba3e13f7da61′
    MICROSOFT_GRAPH_GUID=’00000003-0000-0000-c000-000000000000′

    az ad app create –reply-urls https://$SERVER_APP_NAME –display-name $SERVER_APP_NAME –password $SERVER_APP_PASSWORD
    SERVER_APP_ID=$
    (az ad app list –output json | jq -r –arg appname $SERVER_APP_NAME ‘.[]| select(.displayName==$appname) |.appId’)
    az ad app update –id $SERVER_APP_ID –set groupMembershipClaims=All
    az ad app permission add –id $SERVER_APP_ID –api $MICROSOFT_GRAPH_GUID –api-permissions $USER_READ_ALL_DELEGATED=$AAD_SCOPE $DIRECTORY_READ_ALL_DELEGATED=$AAD_SCOPE $DIRECTORY_READ_ALL_APPLICATION=$AAD_ROLE

    az ad app permission admin-consent –id $SERVER_APP_ID

    #Client Application

    CLIENT_APP_ID=$(az ad app create –display-name “${SERVER_APP_NAME}-Client” –native-app –reply-urls “https://${SERVER_APP_NAME}-Client” –query appId -o tsv)
    SERVER_OAUTH_PERMISSION_ID=$(az ad app show –id $SERVER_APP_ID –query “oauth2Permissions[0].id” -o tsv)

    az ad app permission add –id $CLIENT_APP_ID –api $SERVER_APP_ID –api-permissions $SERVER_OAUTH_PERMISSION_ID=Scope
    #az ad app permission grant –id $CLIENT_APP_ID –api $SERVER_APP_ID
    az ad app permission admin-consent –id $CLIENT_APP_ID

    echo server_app_id = $SERVER_APP_ID
    echo server_app_secret = $SERVER_APP_PASSWORD
    echo client_app_id = $CLIENT_APP_ID

    az aks create -g aks-cluster-resgrp -n hari-aks –aad-server-app-id $SERVER_APP_ID –aad-server-app-secret $SERVER_APP_PASSWORD –aad-client-app-id $CLIENT_APP_ID –node-count 1 –location northeurope -k 1.15.7 -a monitoring -a http_application_routing

    Visit original content creator repository

  • vmware

    Start, Stop, Restart, Console (SSRC)

    A script with useful functions to manage VMs in VMWare vCenter

    This script requires the VMware.PowerCLI module to be installed.

    To install the module, run the following command in PowerShell:

    Install-Module -Name VMware.PowerCLI -AllowClobber -Force

    Usage

    You may need to change the execution policy to run the script. To do this you have a few options:

    Change the Execution Policy Temporarily

    You can change the execution policy for the current PowerShell session only, without affecting the system-wide execution policy:

    Set-ExecutionPolicy -Scope Process -ExecutionPolicy Bypass

    Change the Execution Policy Permanently

    You can change the execution policy permanently for all PowerShell sessions. Open a PowerShell window with “Run as Administrator” option and run:

    Set-ExecutionPolicy RemoteSigned

    This will allow running unsigned scripts that you write on your local computer and signed scripts from the Internet. Please note that this changes the policy permanently. If you want to change it back to the default, run:

    Set-ExecutionPolicy Restricted

    Bypass Execution Policy at Run-time

    You can also bypass the execution policy at run-time with this command:

    powershell.exe -ExecutionPolicy Bypass -File "C:\FILE\LOCATION\vm-ssrc.ps1"

    Run the script

    C:\FILE\LOCATION\vm-ssrc.ps1

    Features

    Function Description
    Create VM Creates a VM by entering the name, selecting the host, datastore, network, OS, RAM, CPU, and disk size.
    Start VM Starts a VM selected from a list of VMs by number.
    Stop VM Stops a VM selected from a list of VMs by number.
    Restart VM Restarts a VM selected from a list of VMs by number.
    Open VM Console Opens the console of a VM selected from a list of VMs by number.
    Get IP Address of VM Gets the IP address of a VM selected from a list of VMs by number.
    Get VM Info Gets the raw VM info of a VM selected from a list of VMs by number.
    VMware Tools Submenu to install, update, or dismount VMware Tools on a VM selected from a list of VMs by number.
    Get VM List Outputs a list of VMs in the vCenter and their power state color coded. Green = Powered On, Red = Powered Off, Yellow = Suspended.
    Delete VM Deletes a VM selected from a list of VMs by number.

    Changelog

    See latest changes here.

    License

    This project is licensed under the Mozilla Public License 2.0 – see the LICENSE file for details.

    Acknowledgments

    Visit original content creator repository

  • aws-dynamodb

    Serverless Components

    Click Here for Version 1.0

    AWS DynamoDB Component ⎯⎯⎯ The easiest way to deploy & manage AWS DynamoDB tables, powered by Serverless Components.

    • Minimal Configuration – With built-in sane defaults.
    • Fast Deployments – Create & update tables in seconds.
    • Team Collaboration – Share your table outputs with your team’s components.
    • Easy Management – Easily manage and monitor your tables with the Serverless Dashboard.

    Check out the Serverless Fullstack Application for a ready-to-use boilerplate and overall great example of how to use this Component.

    1. Install
    2. Initialize
    3. Deploy
    4. Configure
    5. Develop
    6. Monitor
    7. Remove


    1. Install

    To get started with component, install the latest version of the Serverless Framework:

    $ npm install -g serverless
    

    After installation, make sure you connect your AWS account by setting a provider in the org setting page on the Serverless Dashboard.

    2. Initialize

    The easiest way to start using the aws-dynamodb component is by initializing the aws-dynamodb-starter template. Just run this command:

    $ serverless init aws-dynamodb-starter
    $ cd aws-dynamodb-starter
    

    3. Deploy

    Once you have the directory set up, you’re now ready to deploy. Just run the following command from within the directory containing the serverless.yml file:

    $ serverless deploy
    

    Your first deployment might take a little while, but subsequent deployment would just take few seconds. For more information on what’s going on during deployment, you could specify the --debug flag, which would view deployment logs in realtime:

    $ serverless deploy --debug
    

    4. Configure

    The aws-dynamodb component requires minimal configuration with built-in sane defaults. Here’s a complete reference of the serverless.yml file for the aws-dynamodb component:

    component: aws-dynamodb          # (required) name of the component. In that case, it's aws-dynamodb.
    name: my-table                   # (required) name of your instance.
    org: serverlessinc               # (optional) serverless dashboard org. default is the first org you created during signup.
    app: myApp                       # (optional) serverless dashboard app. default is the same as the name property.
    stage: dev                       # (optional) serverless dashboard stage. default is dev.
    
    inputs:
      name: my-table
      attributeDefinitions:
        - AttributeName: id
          AttributeType: S
        - AttributeName: attribute1
          AttributeType: N
      keySchema:
        - AttributeName: id
          KeyType: HASH
        - AttributeName: attribute1
          KeyType: RANGE
      localSecondaryIndexes:
        - IndexName: 'myLocalSecondaryIndex'
          KeySchema:
            - AttributeName: id
              KeyType: HASH
            - AttributeName: attribute2
              KeyType: RANGE
          Projection:
            ProjectionType: 'KEYS_ONLY'
      globalSecondaryIndexes:
        - IndexName: 'myGlobalSecondaryIndex'
          KeySchema:
            - AttributeName: attribute2
              KeyType: HASH
          Projection:
            ProjectionType: 'ALL'
      region: us-east-1

    Once you’ve chosen your configuration, run serverless deploy again (or simply just serverless) to deploy your changes. Please keep in mind that localSecondaryIndexes cannot be updated after first deployment. This is an AWS limitation. Also note that this component exclusively uses the Pay Per Request pricing, which scales on demand like any serverless offering.

    5. Develop

    Instead of having to run serverless deploy everytime you make changes you wanna test, you could enable dev mode, which allows the CLI to watch for changes in your configuration file, and deploy instantly on save.

    To enable dev mode, just run the following command:

    $ serverless dev
    

    6. Monitor

    Anytime you need to know more about your running aws-dynamodb instance, you can run the following command to view the most critical info.

    $ serverless info
    

    This is especially helpful when you want to know the outputs of your instances so that you can reference them in another instance. It also shows you the status of your instance, when it was last deployed, and how many times it was deployed. You will also see a url where you’ll be able to view more info about your instance on the Serverless Dashboard.

    To digg even deeper, you can pass the --debug flag to view the state of your component instance in case the deployment failed for any reason.

    $ serverless info --debug
    

    7. Remove

    If you wanna tear down your entire aws-dynamodb infrastructure that was created during deployment, just run the following command in the directory containing the serverless.yml file.

    $ serverless remove
    

    The aws-dynamodb component will then use all the data it needs from the built-in state storage system to delete only the relavent cloud resources that it created. Just like deployment, you could also specify a --debug flag for realtime logs from the website component running in the cloud.

    $ serverless remove --debug
    

    Visit original content creator repository

  • Chest-X-Ray-Medical-Diagnosis-with-Deep-Learning

    Chest-X-Ray-Medical-Diagnosis-with-Deep-Learning

    Diagnose 14 pathologies on Chest X-Ray using Deep Learning. Perform diagnostic interpretation using GradCAM Method

    Project Description

    This project is a complilation of several sub-projects from Coursera 3-course IA for Medical Specialization. The objective is to use a deep learning model to diagnose pathologies from Chest X-Rays.

    The project uses a pretrained DenseNet-121 model able to diagnose 14 labels such as Cardiomegaly, Mass, Pneumothorax or Edema. In other words, this single model can provide binary classification predictions for each of the 14 labeled pathologies.

    Weight normalization is performed to offset the low prevalence of the abnormalities among the dataset of X-Rays (class imbalance).

    Finally the GradCAM technique is used to highlight and visualize where the model is looking, which area of interest is used to make the prediction. This is a tool which can be helpful for discovery of markers, error analysis, training and even in deployment.

    Dataset

    The project uses chest x-ray images taken from the public ChestX-ray8 dataset. This dataset contains 108,948 frontal-view X-ray images of 32,717 unique patients. Each image in the data set contains multiple text-mined labels identifying 14 different pathological conditions. These in turn can be used by physicians to diagnose 8 different diseases. For the project we have been working with a ~1000 image subset of the images.

    • 875 images to be used for training.
    • 109 images to be used for validation.
    • 420 images to be used for testing.

    The dataset includes a CSV file that provides the ground truth labels for each X-ray.

    DenseNet highlights

    DenseNet was introduced in 2017 in an award-winning paper by Gao Huang et al. 2018 called Densely Connected Convolutional Networks. The model was able to outperform previous architectures like ResNet (which I covered in a another project Skin Cancer AI dermatologist).

    Regardless of the architectural designs of these networks, they all try to create channels for information to flow between the initial layers and the final layers. DenseNet, with the same objective, create paths between the layers of the network. Parts of this summary are can be found in this review.

    • DenseNet key novelty: Densenet is a convolutional network where each layer is connected to all other layers that are deeper in the network
      • The first layer is connected to the 2nd, 3rd, 4th etc.
      • The second layer is connected to the 3rd, 4th, 5th etc.

    Each layer in a dense block receives feature maps from all the preceding layers, and passes its output to all subsequent layers. Feature maps received from other layers are fused through concatenation, and not through summation (like in ResNets). Extracted feature maps are continuously added together with previous ones which avoids redundant and duplicate work.

    This allows the network to re-use learned information and be more efficient. Such networks require fewer layers. State of the art results are achieved with as low as 12 channel feature maps. This also means the network has fewer parameters to learn and is therefore easier to train. Amongst all variants, DenseNet-121 is the standard one.

    Key contributions of the DenseNet architecture:

    • Alleviates vanishing gradient problem ( as networks get deeper, gradients aren’t back-propagated sufficiently to the initial layers of the network. The gradients keep getting smaller as they move backwards into the network and as a result, the initial layers lose their capacity to learn the basic low-level features)
    • Stronger feature propagation
    • Feature re-use
    • Reduced parameter count

    DenseNet architecture

    DenseNet is composed of Dense blocks. In those blocks, the layers are densely connected together: Each layer receive in input all previous layers output feature maps. The DenseNet-121 comprises 4 dense blocks, which themselves comprise 6 to 24 dense layers.

    • Dense block: A dense block comprises n dense layers. These dense layers are connected such that each dense layer receives feature maps from all preceding layers and passes it’s feature maps to all subsequent layers. The dimensions of the features (width, height) stay the same in a dense block.

    • Dense layer: Each dense-layer consists of 2 convolutional operations.
      • 1 X 1 CONV (conventional conv operation for extracting features)
      • 3 X 3 CONV (bringing down the feature depth/channel count)

    The CONV layer corresponds to the sequence BatchNorm->ReLU->Conv. A layer has each sequence repeated twice, the first with 1×1 Convolution bottleneck producing: grow rate x 4 feature maps, the second with 3×3 convolution. The authors found that the pre-activation mode (BN and ReLU before the Conv) was more efficient than the usual post-activation mode.

    The growth rate (k= 32 for DenseNet-121) defines the number of output feature maps of a layer. Basically the layers output 32 feature maps which are added to a number of 32 feature maps from previous layers. While the depth increases continuously, each layer bring back the depth to 32.

    • Transition layer: In between dense blocks, you find Transition layer. Instead of summing the residual like in ResNet, DenseNet concatenates all the feature maps. A transition layer is made of: Batch Normalization -> 1×1 Convolution -> Average pooling. Transition layers between two dense blocks ensure the down-sampling role (x and y dimensions halved), essential to CNN. Transition layers also compress the feature map and reduce the channels by half. This contributes to the compactness of the network.

    Although Concatenating generates a lot of input channels, DenseNet’s convolution generates a low number of feature maps (The authors recommend 32 for optimal performance but world-class performance was achieved with only 12 output channels).

    Key benefits:

    • Compactness. DenseNet-201 with 20M parameters yields similar validation error as a 101-layer ResNet with 45M parameters.
    • The learned features are non-redundant as they are all shared through a common knowledge.
    • Easier to train because the gradient is flowing back more easily thanks to the short connections.

    Model settings

    In this project, the model uses 320 x 320 X-Rays images and outputs predictions for each of the 14 pathologies as illustrated below on a sample image.

    Environment and dependencies

    In order to run the model, I used an environment with tensorflow 1.15.0 and Keras 2.1.6. Model weights are provided in the repo.

    Results

    I used a pre-trained model which performance can be evaluated using the ROC curve shown at the bottom. The best results are achieved for Cardiomegaly (0.9 AUC), Edema (0.86) and Mass (0.82). Ideally we want to be significantly closer to 1. You can check out below the performance from the ChexNeXt paper and their model as well as radiologists on this dataset.

    Looking at unseen X-Rays, the model correctly predicts the predominant pathology, generating a somehow accurate diagnotic, highlighting the key region underlying its predictions. In addition to the main diagnostic (highest prediction), the model also predicts secondary issues similarly to what a radiologist would comment as part of his analysis. This can be either false positive from noise captured in the X-rays or cumulated pathologies.

    The model correctly predicts Cardiomegaly and absence of mass or edema. The probability for mass is higher, and we can see that it may be influenced by the shapes in the middle of the chest cavity, as well as around the shoulder.

    The model picks up the mass near the center of the chest cavity on the right. Edema has a high score for this image, though the ground truth doesn’t mention it.

    Here the model correctly picks up the signs of edema near the bottom of the chest cavity. We can also notice that Cardiomegaly has a high score for this image, though the ground truth doesn’t include it. This visualization might be helpful for error analysis; for example, we can notice that the model is indeed looking at the expected area to make the prediction.

    Performance from the ChexNeXt paper (model as well as radiologists):

    Visit original content creator repository
  • ulid-generator-rs

    ulid-generator-rs

    A Rust crate for generating ULIDs.

    Workflow Status crates.io docs.rs dependency status tokei

    Install to Cargo.toml

    Add this to your Cargo.toml:

    [dependencies]
    ulid-generator-rs = "<<version>>"

    About ULID

    ULID is Universally Unique Lexicographically Sortable Identifier.

    For more information, please check the following specifications.

    Usage

    use ulid_generator_rs::{ULIDGenerator, ULID};
    
    let mut generator: ULIDGenerator = ULIDGenerator::new();
    let ulid: ULID = generator.generate().unwrap();
    let str: String = ulid.to_string();
    println!("{}", str); // "01ETGRM6448X1HM0PYWG2KT648"

    Alternative crates

    Benchmarks

    gen_ulid_and_to_string/j5ik2o/ulid-generator-rs/gen_to_str/0
    time:   [117.15 ns 117.26 ns 117.39 ns]
    change: [-1.7662% -0.9620% -0.3349%] (p = 0.00 < 0.05)
    Change within noise threshold.
    Found 3 outliers among 100 measurements (3.00%)
    2 (2.00%) high mild
    1 (1.00%) high severe
    
    gen_ulid_and_to_string/dylanhart/ulid-rs/gen_to_str/0
    time:   [115.63 ns 115.81 ns 116.04 ns]
    change: [-1.0856% -0.8741% -0.6850%] (p = 0.00 < 0.05)
    Change within noise threshold.
    Found 4 outliers among 100 measurements (4.00%)
    2 (2.00%) high mild
    2 (2.00%) high severe
    
    gen_ulid_and_to_string/huxi/rusty_ulid/gen_to_str/0
    time:   [126.32 ns 126.46 ns 126.60 ns]
    change: [-0.4696% -0.3016% -0.1476%] (p = 0.00 < 0.05)
    Change within noise threshold.
    Found 2 outliers among 100 measurements (2.00%)
    2 (2.00%) high mild
    
    gen_ulid_and_to_string/suyash/ulid-rs/gen_to_str/0
    time:   [157.22 ns 157.35 ns 157.49 ns]
    change: [-1.6453% -1.4630% -1.2639%] (p = 0.00 < 0.05)
    Performance has improved.
    Found 4 outliers among 100 measurements (4.00%)
    3 (3.00%) high mild
    1 (1.00%) high severe
    

    License

    Licensed under either of

    at your option.

    Contribution

    Unless you explicitly state otherwise, any contribution intentionally submitted for inclusion in the work by you, as defined in the Apache-2.0 license, shall be dual licensed as above, without any additional terms or conditions.

    Visit original content creator repository
  • calcanim

    Calcanim

    Este es un repositorio donde encontrarás todos los códigos usados para generar las animaciones de la lista de reproducción Calcanim de nuestro canal de YouTube Animathica. Las animaciones están hechas con Manim.

    ¡Te invitamos a descargar y modificar nuestros archivos! Para que puedas generar tus videos después de modificar un archivo, será necesario que tengas una instalación completa y estable de Manim. Te recomendamos los siguientes tutoriales:

    Windows:

    Linux:

    macOS:

    Para que nuestros archivos se puedan ejecutar bien, es necesario que instales la última versión de Manim. Además, en el archivo tex_template.tex en la carpeta manimlib, debes modificar el paquete babel de english a spanish.

    Si lo prefieres, puedes usar esta aplicación en línea que te permitirá generar tus videos:
    https://eulertour.com/gallery

    Temario

    Introducción al cálculo multivariable:

    Espacios vectoriales:

    Sucesiones:

    Topología de R^n:

    Límite y continuidad en funciones multivariable:

    Calculo diferencial en curvas:

    Cálculo diferencial de superficies

    Extra:

    Funciones de R^n a R^m:

    Teoremas de diferenciabilidad:

    Integral de volumen:

    Integral de línea:

    • Definición
    • Teoremas fundamentales
    • Rotacional en R^2
    • Teorema de Green
    • Rotacional en R^3

    Integral de superficie:

    • Definición
    • Stokes
    • Divergencia
    • Gauss

    Visit original content creator repository

  • lyricsFinder

    This project was bootstrapped with Create React App.

    Available Scripts

    In the project directory, you can run:

    yarn start

    Runs the app in the development mode.
    Open http://localhost:3000 to view it in the browser.

    The page will reload if you make edits.
    You will also see any lint errors in the console.

    yarn test

    Launches the test runner in the interactive watch mode.
    See the section about running tests for more information.

    yarn build

    Builds the app for production to the build folder.
    It correctly bundles React in production mode and optimizes the build for the best performance.

    The build is minified and the filenames include the hashes.
    Your app is ready to be deployed!

    See the section about deployment for more information.

    yarn eject

    Note: this is a one-way operation. Once you eject, you can’t go back!

    If you aren’t satisfied with the build tool and configuration choices, you can eject at any time. This command will remove the single build dependency from your project.

    Instead, it will copy all the configuration files and the transitive dependencies (webpack, Babel, ESLint, etc) right into your project so you have full control over them. All of the commands except eject will still work, but they will point to the copied scripts so you can tweak them. At this point you’re on your own.

    You don’t have to ever use eject. The curated feature set is suitable for small and middle deployments, and you shouldn’t feel obligated to use this feature. However we understand that this tool wouldn’t be useful if you couldn’t customize it when you are ready for it.

    About App

    This app is mainly created in admiration of the learning of context component of the reactJs.

    • libaray used in it:
    1. axios
    2. ant-design
    3. react-router-dom

    axious

    • To get data from backend in Lifecycle Hooks i.e

    componentDidMount(){
      const promis = axios.get('url')
    }
    • requests of axios

    axios
      .get('url')
      .then(function(respose) {
        //handle success
      })
      .catch(function(error) {
        //handle errors
      });

    context or context API

    • React’s context allows you to share information to any components, without any help of props.
    • Context provides a way to pass data through the component tree without having to pass props down manually at every level.

    Create file of context.jsx in root path

    • context component:
    const Context = React.createContext();
    • There are two export component :
    1. class Provider

    For adding in root file App.js
    Changing state by using the dispatch redux property

    export class Provider extends Component{
      state={
        data:[]
        dispatch:action => this.setState(state => reducer(state,action))
         // you have to define or use this element in other file with the same 'type' component in it and after that help of payload we can change the state.
      };
      componentDidMound(){
        //if you want ot change state in file by 'setState'
      }
      render(){
        return (
          <Context.Provider value={this.state}>
          {this.props.childern}
          </Context.Provider>
        );
      }
    }

    reducer component:

    const reducer = (state, action) => {
      switch (action.type) {
        case 'objcet_in_type':
          return {
            ...state,
            data: action.payload // payload is the change data that comes from the another file where the 'Consumer' used.
          };
        default:
          return state;
      }
    };
    1. const Consumer

    For adding in file where we can use the states or values that provide by the provider.

    export const Consumer = Context.Consumer;

    Learn More

    You can learn more in the Create React App documentation.

    To learn React, check out the React documentation.

    Code Splitting

    This section has moved here: https://facebook.github.io/create-react-app/docs/code-splitting

    Analyzing the Bundle Size

    This section has moved here: https://facebook.github.io/create-react-app/docs/analyzing-the-bundle-size

    Making a Progressive Web App

    This section has moved here: https://facebook.github.io/create-react-app/docs/making-a-progressive-web-app

    Advanced Configuration

    This section has moved here: https://facebook.github.io/create-react-app/docs/advanced-configuration

    Deployment

    This section has moved here: https://facebook.github.io/create-react-app/docs/deployment

    yarn build fails to minify

    This section has moved here: https://facebook.github.io/create-react-app/docs/troubleshooting#npm-run-build-fails-to-minify

    Visit original content creator repository

  • HealthConnect

    HealthConnect

    Contribute:

    To contribute something to HealthConnect, please refer to our contributing document

    Features:

    Open Source Medical IoT Application. Use any device – ESP32/ESP8266 Dev Board, Raspberry Pi, Smart Phone – connect the sensors and add your device on your account. Then view your medical sensor data sent to the cloud in REAL TIME.

    • Ability to access Patient Data remotely (Dashboard)
    • Digital Multi Para Monitor
    • Schedule appointments based on Doctor’s calendar
    • AI Symptom Checking ChatBot for quick queries
    • Order medicines according to Doctor’s consultancy
    • Use digital notes provided by nurse/doctor as instructions related to health.
    • Quick updated helpline numbers to access nearest Hospital/Ambulance

    From this Project, we are trying to analyze the problems faced by people while performing their tests and finding a diagnostics solution for it after the results of the lab tests are given.

    All these tests need not be taken in the hospitals, an IoT device, whose prototype that we have built can track and upload the data to the cloud. This data can be analyzed on a Machine learning Algorithm and cross-reference to find the accurate anomalies in the patient’s body.

    These could include infection, disorders, diseases, or any health condition which is unlikely in usual cases.

    The focus is on having a portable ICU, with which the medical help can be reached to the people remotely.

    Get Started:

    1. Visit the SignUp Page and Create your Account.
    2. Now visit Login Page and login.
    3. View existing sample/dummy data on the portal.
    4. Explore the features on sidebar, and view sample vitals on the Dashboard and Diagnostics.
    5. To view your own data or realtime data sample – you’ll have to add you device to the cloud.
    6. Click on Medical Devices on the sidebar, and follow the instructions to Add your Device.
    7. View RealTime health vitals of your your body on the Dashboard and Diagnostics.

    HealthConnect Portal Interface (Patient):

    Dashboard View

    image

    Digital Multi Para Monitor

    image

    Medical Device Control Panel

    image

    Diagnose Report with Prescription

    image

    Calendar Appointments

    image

    HealthCare Visit

    image

    Symptom Check (AI Bot)

    image

    HealthConnect Portal Interface (Admin):

    Dashboard View

    WhatsApp Image 2022-03-05 at 10 15 21 PM

    Visit original content creator repository